Why Your Content ROI Metrics Aren’t Telling the Full Story (and What to Measure Instead)
Discover why traditional content ROI metrics fall short and learn smarter ways to measure trust, engagement, and long-term business impact with actionable tips.
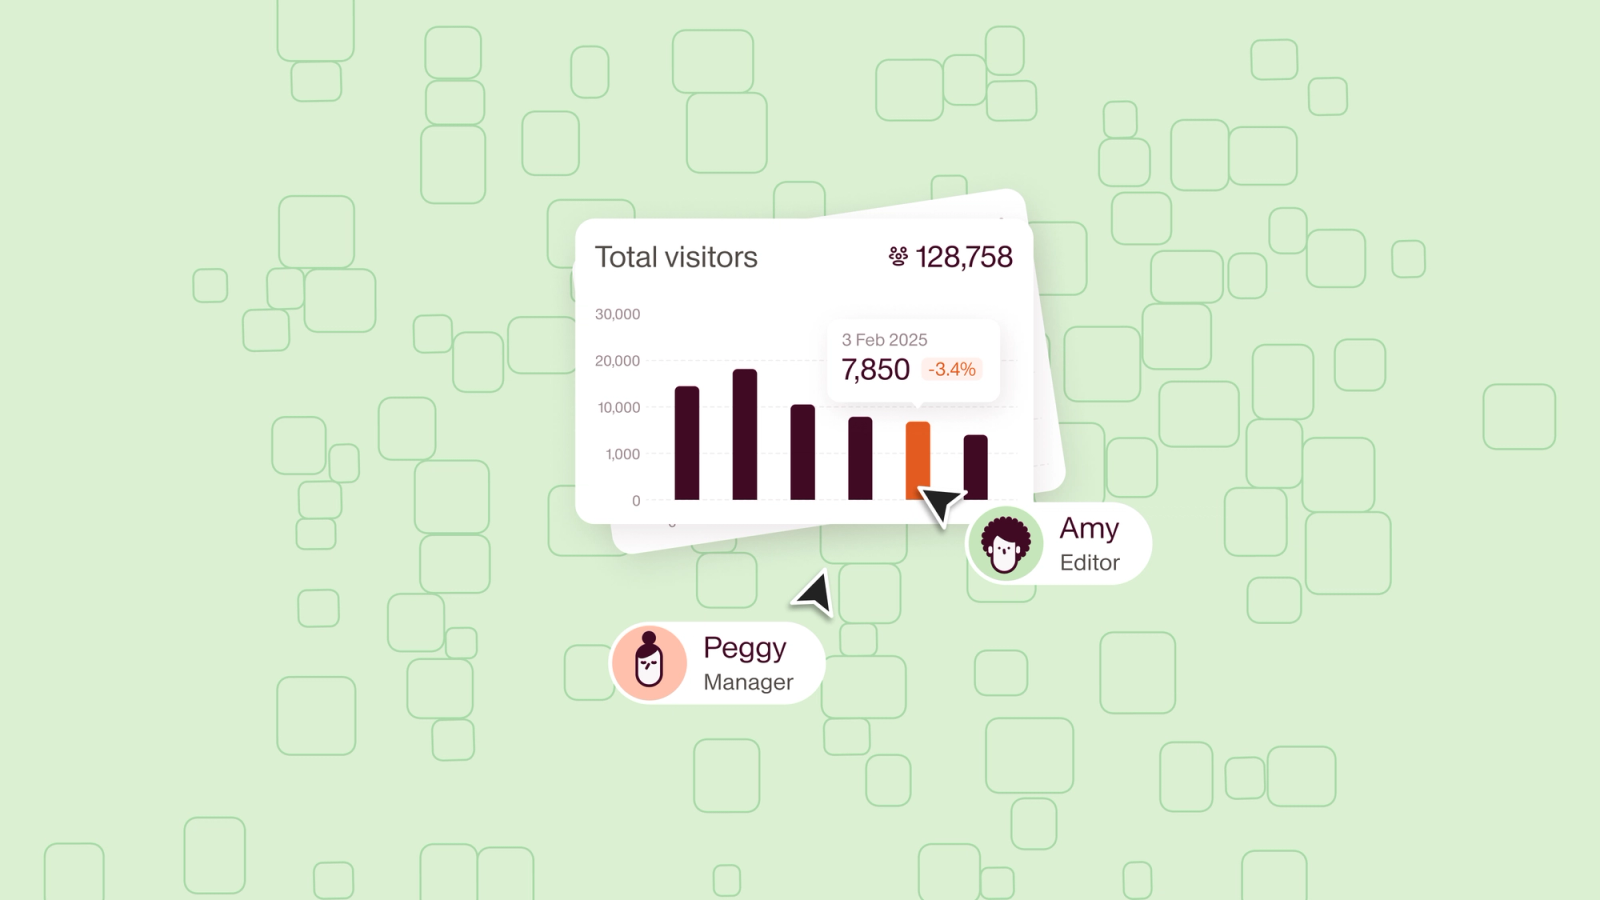
Content ROI metrics can be a tricky puzzle to solve. You’ve been there, staring at your content dashboard, watching numbers climb. Page views, social shares, and clicks might look great, but when the campaign wraps up, you’re left asking:
Did those numbers actually move the needle for your business?
Did they build trust with your audience, nurture leads, or turn readers into loyal customers?
Content plays multiple roles in your marketing strategy. Whether transactional (driving immediate leads), relational (building brand trust), or supporting (empowering your sales team), each type of content demands a tailored approach to measurement. Metrics that ignore these nuances won’t give you the clarity you need to drive results.
As Sara Stella Lattanzio points out, “Most companies treat content like an on-and-off switch—and this never, ever works.” To see real impact, your strategy must go beyond surface metrics and short-term wins. It’s time to rethink how you measure success, focusing on metrics that reflect real business goals like trust, engagement, and growth.
Why traditional content ROI metrics fall short
Traditional content metrics can give a false sense of accomplishment. Page views, clicks, and shares might look impressive in a report, but they rarely show whether your content is driving meaningful results.
These metrics work well for transactional content. They miss the mark when measuring long-term impact like building trust or turning casual readers into loyal advocates.
Snapshot metrics lack depth
Vanity metrics like page views and clicks offer a surface-level view of activity. They don’t answer the bigger question: is your content actually connecting with your audience?
To dig deeper, focus on metrics like engagement rate and scroll depth. One caution if you are reading these in GA4: bounce rate there is simply the inverse of engagement rate, and Google counts a session as engaged if it lasts longer than 10 seconds, records a key event, or includes two or more page views. Ten seconds is a low bar, so a healthy looking engagement rate can still describe readers who glanced and left. Scroll depth and time on page tell you more about whether the piece was actually read. Tools like heatmaps, as Lakshaya Baliyan points out, can pinpoint exactly where users lose interest. This could be a buried CTA, an underwhelming headline, or something else entirely.
Here’s an example. Suppose you run a campaign that brings a ton of traffic to your landing page. That’s a strong start. But if most visitors leave after a few seconds, there’s an issue. Monitoring engagement metrics helps you assess the quality of your content, not just the volume of your traffic.
The trap of quick wins
Quick spikes in traffic or clicks can be tempting. But short-term wins often lead to reactive strategies that don’t build sustainable results. You might end up chasing what’s trending today instead of creating a foundation for long-term growth.
Metrics like session-to-contact rates and engagement time shift your focus to what matters. They show whether your audience finds value in your content, comes back for more, or takes the next step in their journey with you. These are the moments that move the needle for your brand.
Measure what actually moves the needle.
Relato connects your content workflows to the metrics that matter, not just vanity numbers.
Misaligned metrics, misaligned goals
Vanity metrics might look good on paper, but they don’t connect to outcomes that matter, like revenue, lead generation, or customer retention. When content metrics aren’t tied to business goals, it becomes easy to lose direction and focus.
The fix starts with alignment. Tie your content metrics directly to your business objectives. OKRs (Objectives and Key Results) can help connect your efforts to measurable outcomes.
For example:
- Track leads generated from a gated ebook
- Measure the lifetime value of blog readers who convert
Metrics like these provide a clear view of how your content drives growth. They resonate with stakeholders and reinforce the strategic value of your work.
How to measure content ROI
The short version: pick one transactional metric and one relational metric, tie both to a business goal, and track them over a quarter rather than a single campaign. Most teams drown because they try to measure ten things at once, or they chase vanity numbers that look good in a report but never tie to revenue, one of the quiet reasons content strategies stall. You do not need a full attribution stack to get a defensible number.
Here is a workable sequence:
- Name the goal first. Pipeline, retention, or brand trust. The goal decides the metric, not the other way around.
- Pick one transactional metric. Influenced pipeline, marketing qualified leads, or demo requests. Something a finance team already recognizes.
- Pick one relational metric. Organic sessions, branded search, return visits, or time on page. This is the slow-burn signal that transactional numbers miss.
- Divide value by cost. Add up content spend (headcount, freelancers, software) and compare it to the pipeline your content touched. That ratio is your return on content spend.
- Add self-reported attribution. Ask new signups where they heard about you. It is imperfect, and it catches the influence your analytics cannot.
For the full formula, including how return on content spend holds up in a CFO conversation, our companion guide on how to measure content marketing ROI walks through each step with examples.
How to track content ROI over time
Content ROI is a trend, not a snapshot. A single month tells you almost nothing, because the compounding value of content shows up over quarters. Set a baseline, pick your two metrics, and review them on the same cadence every quarter.
Two habits make the trend readable:
- Keep the metric set fixed. Swapping metrics every review resets the trend line and hides progress. Choose your two or three numbers and leave them alone for at least two quarters.
- Roll visibility into one number. In a zero-click world, a lot of content value never becomes a click. Our four-metric model for organic visibility in a zero-click world shows how to compress that into a single quarterly figure you can trend.
When the trend moves in the right direction across two or three quarters, you have proof. When it is flat, you have a reason to change the work, not the metric.
How to tie content engagement data back to revenue outcomes
Engagement data and revenue data live in different systems, which is why the line between them feels impossible to draw. You do not need to merge those systems. You need one shared key that shows up on both sides.
The workable version is three steps:
- Give every piece a stable identifier. The URL is usually enough. Whatever you pick has to survive a redesign, because attribution breaks the moment slugs change and nobody notices until the quarter is over.
- Capture that identifier at the moment of conversion. A hidden field on your demo form that records the last few pages a visitor saw is cruder than a full attribution stack, and it answers most of what people actually ask in the meeting.
- Roll it up by piece, not by channel. “Organic drove pipeline this quarter” ends the conversation. “These four posts show up in the path of most of our closed deals” starts a different one, because it tells you what to write next.
What comes out of that is influenced pipeline, not attributed revenue, and it is worth saying so out loud. Influenced means the buyer touched the content somewhere along the way. It does not claim the content caused the purchase. Finance teams are comfortable with influence when you label it as influence. They stop trusting the whole report when a soft number gets presented as a hard one.
When the strategy looks fine on paper but nothing shows up in the data
There is a specific failure worth naming, because it usually gets misdiagnosed as a strategy problem. The pillars are sensible, the calendar is full, the work ships on time, and still no number anyone can point at moves. Usually one of three things is true:
- Nobody instrumented the measurement. The form field was never added, the UTM convention was never agreed, and no one asks new signups where they heard about you. Analysis cannot recover a signal that was never recorded.
- The window is too short. Content compounds over quarters, so a monthly review of a program that takes two or three quarters to surface reads as flat every month, right up until it does not. Reviewing on a quarterly cadence is what makes the trend visible at all.
- The metric does not fit the job. Judge a trust-building piece by demo requests and it will always look like failure, because demo requests were never what it was for.
The fix is instrumentation and patience, not another dashboard.
How to prove the ROI of content that AI assistants quote but never send a click
This is the hardest version of the measurement problem and it is now the ordinary one. Your page gets read and quoted inside an AI answer, the reader gets what they came for, and no click ever lands in your analytics. The old proof chain of impression, click, session, conversion breaks at the second link.
Part of this became measurable in 2026. In June, Google launched a generative AI performance report in Search Console covering AI Overviews and AI Mode. It is worth being precise about what it gives you, because the gap between what people assume it reports and what it actually reports is where bad slides come from. Google’s documentation says the report shows impressions grouped by page, country, device and date. There is no query dimension, and it does not break out clicks, click-through rate or position. The same data also flows into the standard Performance report under the “Web” search type.
So you can prove a page is being surfaced inside AI answers, and you can trend that month over month. You cannot see which question triggered it, and you cannot calculate a click-through rate on it. That makes it a visibility metric rather than a return metric, and it belongs on the relational side of the ledger instead of in the pipeline math.
Google also states that clicks from result pages carrying AI Overviews tend to be higher quality, with users spending more time on the site. That is Google describing its own product, and it has not published the underlying data, so treat it as a claim to test against your own engagement numbers rather than a finding to repeat in a board deck.
For citations that happen outside Google entirely, in ChatGPT or Perplexity, there is still no equivalent report. Two things work in the meantime and both are imperfect:
- Self-reported attribution. Adding “how did you hear about us?” to your signup flow catches influence your analytics cannot see. When a free-text answer names a specific article, or says an assistant recommended you, that is the only direct evidence you are going to get.
- Prompt-based visibility checks. Run a fixed set of buyer questions across the assistants on a regular cadence and log whether you appear. That turns a vague sense of presence into a trend line. Our guide to generative engine optimization covers how to build the prompt set and what to log.
Say the uncertainty out loud when you present any of this. Nobody has a clean number for AI-cited content yet, and a team that admits the gap keeps its credibility when someone questions the methodology. A team that presents an invented figure does not get it back.
How to measure content relevance
Content relevance is whether a page satisfies the specific intent behind the search that brings someone to it, and you measure it by checking intent match first and reader behavior second. Intent match asks a plain question: does the page rank and earn clicks for the queries it was written to answer, and do those queries describe a real reader need rather than a phrase you happened to like. A page that ranks for terms nobody in your market searches with buying intent is performing, but it is not relevant to your business.
Then read engagement as a relevance signal rather than a traffic one. Scroll depth, time on page, and the rate at which readers move to a next step tell you whether the content answered the question or sent the reader back to the results. Coverage matters too, because a relevant page answers the follow-up questions a reader would ask next, which is why in-depth pages tend to hold attention and get cited. For content that AI assistants surface, relevance is whether yours is the page quoted when someone asks the buyer’s question, so track how often your pages appear across a fixed set of those prompts, the same way you would for generative engine optimization. Recheck on a quarterly cadence, because a page that was relevant last year drifts as intent and competition change.
Content tracking: what to actually track
Track a small, fixed set of metrics tied to a business goal, not everything the dashboard can produce. The workable minimum is one transactional metric and one relational metric: influenced pipeline, qualified leads, or demo requests on the transactional side, and organic sessions, branded search, or return visits on the relational side. Keeping the set fixed matters more than picking perfect metrics, because swapping them each quarter resets the trend line and hides whether the content is working.
Track by piece, not only by channel. Use the page URL as the shared key between your analytics and your CRM so you can see which specific posts sit in the path of closed deals, and label the result influenced pipeline rather than attributed revenue, since a buyer touching a page on the way is not proof the page caused the deal. Add self-reported attribution by asking new signups where they heard about you, which catches influence your analytics cannot see, including the reads that happen inside an AI answer and never send a click. Review the same set on the same cadence each quarter, because content compounds over quarters, not campaigns.
What to measure instead
If you’re ready to move past vanity metrics, it’s time to focus on what really matters. Relational goals like building trust and authority can be harder to quantify, but they are essential for long-term success.
As Rosanna Campbell argues in her Relato guide to measuring the ROI of content over the long game, relational metrics require more nuanced tools and approaches than transactional content. Here are a few key areas to measure instead.
Brand trust
Trust is earned when you consistently deliver value and meet audience expectations. It’s what turns casual readers into loyal advocates.
How do you measure it? Start with sentiment analysis tools to track mentions, comments, and reviews. Positive responses, enthusiasm, and constructive engagement are strong signals of trust.
Lindsey Tague recommends pairing sentiment analysis with retention data and surveys. Look for audiences that return, share positive feedback, and engage directly with your content. Collaborate with sales to identify patterns in organic and zero-click content that reflect growing trust. (Our four-metric model for organic visibility in a zero-click world covers how to roll this up into a single quarterly number.)
Audience participation (likes, shares, and comments) also tells the story. When people see your brand as reliable and valuable, they engage and keep coming back.
Engagement over time
Great content holds attention and keeps people coming back. Metrics like engagement time and scroll depth show how well your content connects with your audience. Did they read to the end, or did they drop off halfway?
Derek Fox captures it well: “Content’s value is often in the intangibles that drive big results over time.”
To measure engagement more effectively, track:
- Session-to-contact rates
- Repeat visits
- Session duration
These metrics highlight how your content builds momentum over time.
Email metrics like open rates and unsubscribe rates also reflect ongoing engagement. High open rates and low unsubscribes signal that your audience finds consistent value in what you’re sharing.
When audiences return repeatedly, it’s a clear sign that your content is creating a lasting impact.
Lead nurturing
Nurturing leads is about proving your value at every step of their journey. Multi-touch attribution models can identify which pieces of content nudge leads closer to conversion.
As Liam Carnahan points out, content ROI often depends on its purpose. SEO content may not immediately convert sales, but it increases traffic and sets the stage for future opportunities.
To connect content to conversions, measure:
- Click-through rates on gated resources
- Conversion rates on downloadable content
For example, if someone reads your whitepaper and then books a demo, that’s a clear sign your content is driving action.
Authority building
Authority is about influence. It’s proof that your brand leads the conversation, drives thought leadership, and earns industry recognition.
Key indicators of authority include:
Media mentions: Getting cited in well-known publications, reports, or news outlets.
Industry awards: Recognition from credible organizations signals that your work sets a standard.
Speaking invitations: Thought leaders don’t just create content; they’re invited to share it on panels, webinars, podcasts, or events.
When your content gets cited by industry leaders or spotlighted in media reports, it signals that you’re influencing perceptions and shaping conversations. Authority amplifies your reach, builds credibility, and positions your brand as a trusted resource.
Measure what actually moves the needle.
Relato connects your content workflows to the metrics that matter, not just vanity numbers.
Retention and loyalty
Retention is where content creates measurable, long-term impact. As Treasa Edmond explains, “Content ROI can be measured—it just takes the right approach. Tie content to lead generation, sales touchpoints, or customer retention metrics.”
Customer Lifetime Value (CLV) is a key metric for retention. To measure CLV through content, focus on:
Content touchpoints: Identify the blogs, guides, or emails customers engage with before repeat purchases or upsells.
Attribution models: Use first-touch, last-touch, or multi-touch attribution to connect content to customer value.
Engagement metrics over time: Track repeat visits, time spent on content, and email click-through rates.
CLV grows when your content answers customer needs at every stage. For example:
- Onboarding guides that reduce churn
- Case studies that demonstrate real results
- Educational emails that encourage continued product use
High CLV signals that your content fosters loyalty, deepens engagement, and turns customers into long-term advocates.
How to implement smarter content ROI metrics
Switching to meaningful metrics takes a plan. Balance metrics across all content roles: transactional, relational, and supporting. This approach captures the full spectrum of your content’s impact. From auditing your current data to aligning with business goals and optimizing as you go, these steps will help you build smarter tracking into your workflow.
Step 1: Audit current metrics
Start by taking a hard look at your current metrics. Are they telling a meaningful story or just numbers on a dashboard?
Tools like Google Analytics, Ahrefs, or HubSpot can uncover gaps in your tracking. For example, you might measure clicks but miss insights on how long people stay engaged or what content drives conversions.
Your current metrics don’t need to be perfect, but they should highlight trends and benchmarks over time. Use this data to pinpoint what’s working and where you need to dig deeper. Move beyond surface-level numbers and focus on insights that drive strategic decisions. Pairing several signals beats trusting one, which is how smart teams use layered data to drive better content decisions.
Step 2: Define business goals and KPIs
Metrics without goals don’t show value. Tie your tracking to outcomes that matter most, like lead generation, customer retention, or revenue growth.
Align these goals with your OKRs so everything connects back to your larger business objectives. Focus on KPIs that provide actionable insights, like:
Session-to-contact rates
Content click-through efficiency
These KPIs make it clear how your content supports your business goals and helps prioritize what to measure.
Step 3: Leverage advanced tools
Advanced tools provide a deeper understanding of your content’s impact. Use sentiment analysis platforms or social listening tools to measure trust. These tools track how people talk about your brand and whether responses are positive or negative.
Implement multi-touch attribution models to identify how content influences the audience at each stage of their journey. For example, attribution can reveal which blogs, emails, or gated resources move leads closer to conversion.
The right tools uncover the why behind the data, helping you make informed decisions.
Step 4: Iterate and optimize
Metrics are dynamic. Your strategy should be too. Regularly reviewing your numbers helps identify trends, test changes, and uncover what resonates, or what doesn’t.
A/B testing can reveal opportunities to improve performance. Experiment with:
- Headlines
- CTAs
- Content formats
These small tweaks help you learn what engages your audience the most.
As Sanjana Murali puts it, “The beauty of good content is that it compounds over time.” Optimizing today’s content creates compounding results for tomorrow. Identify patterns, scale what works, and refine content that needs improvement. This approach unlocks the full potential of your content over time.
Frequently asked questions about content ROI
How do you measure content ROI?
Pick one transactional metric and one relational metric, tie both to a business goal, and track them over a quarter. Transactional means influenced pipeline, marketing qualified leads, or demo requests. Relational means organic sessions, branded search, or return visits. Add up your content spend and divide the pipeline your content touched by that cost to get return on content spend, then layer in self-reported attribution by asking new signups where they heard about you. You do not need a full attribution stack to defend a content budget.
How do you track content ROI over time?
Set a baseline, choose two or three metrics, and review them on the same cadence every quarter. Keep the metric set fixed for at least two quarters, because swapping metrics resets the trend line and hides progress. Content compounds over quarters, not campaigns, so a single month tells you almost nothing. When the trend moves the right way across two or three reviews, you have proof.
Why do traditional content ROI metrics fall short?
Page views, clicks, and shares measure activity, not impact. They work for transactional content but miss the long-run value of trust, authority, and retention. A campaign can post huge traffic numbers while readers bounce in seconds and no one converts. Vanity metrics also drift away from business goals, so the report looks healthy while the content is not moving revenue or pipeline.
How do you tie content engagement data back to revenue outcomes?
Use one shared key that appears in both your analytics and your CRM, usually the page URL. Capture it at the moment of conversion with a hidden form field that records the last few pages a visitor saw, then roll the result up by piece rather than by channel so you can see which specific posts sit in the path of closed deals. What you get is influenced pipeline, not attributed revenue, and you should label it that way. Influenced means the buyer touched the content on the way, not that the content caused the purchase.
How do you prove the ROI of content that AI assistants quote but that does not drive clicks?
For Google, use the generative AI performance report Search Console launched in June 2026. It reports impressions from AI Overviews and AI Mode grouped by page, country, device and date. It has no query dimension and does not report clicks, click-through rate or position, so treat it as a visibility metric rather than a return metric. For assistants outside Google there is no equivalent report, so rely on self-reported attribution at signup and on running a fixed set of buyer prompts on a regular cadence to log whether you appear. Be explicit that these are partial measures.
What should you measure instead of vanity metrics?
Measure brand trust (sentiment, retention, direct engagement), engagement over time (session-to-contact rate, repeat visits, session duration), lead nurturing (multi-touch influence and conversions on gated content), authority (media mentions, awards, speaking invitations), and retention through customer lifetime value tied to content touchpoints. Balance one transactional metric against one relational metric so you capture both immediate leads and long-term relationships.
How do you measure content relevance?
Check whether a page satisfies the search intent behind the queries that bring readers to it, then whether those readers act on it. Look at intent match, whether the page ranks and earns clicks for the queries it answers, and whether those queries describe a real buying need. Read engagement as a quality signal through scroll depth, time on page, and movement to a next step, and check topical coverage, whether the page answers the follow-up questions too. For AI assistants, track how often your pages are quoted across a fixed set of buyer prompts. Recheck quarterly, because relevance drifts as intent and competition change.
What should you track to measure content performance?
Track a small, fixed set tied to a business goal: one transactional metric such as influenced pipeline, qualified leads, or demo requests, and one relational metric such as organic sessions, branded search, or return visits. Track by piece using the page URL as the shared key between your analytics and your CRM, label the result influenced pipeline rather than attributed revenue, and add self-reported attribution at signup to catch what click data misses. Keep the set fixed and review it on the same quarterly cadence, because content compounds over quarters, not campaigns.
Rethinking content ROI: your next move
No single metric will capture your content’s full impact. Focusing on clicks and shares might feel satisfying, but it doesn’t show the true value of your work.
The smarter approach highlights trust, authority, and long-term engagement. As Erin Pennings puts it, “The ROI is so hard to prove, but I also believe that good content marketing (emphasis on the ‘good’) is table stakes for companies wanting to build relationships with their audience.”
Impactful content lays the groundwork for sustainable growth. It fosters trust, drives engagement, and builds authentic relationships, which is where the real ROI lives.
Ready to simplify your content tracking and focus on what truly matters? Sign up for early access to Relato and start building metrics that move the needle.
Measure what actually moves the needle.
Relato connects your content workflows to the metrics that matter, not just vanity numbers.